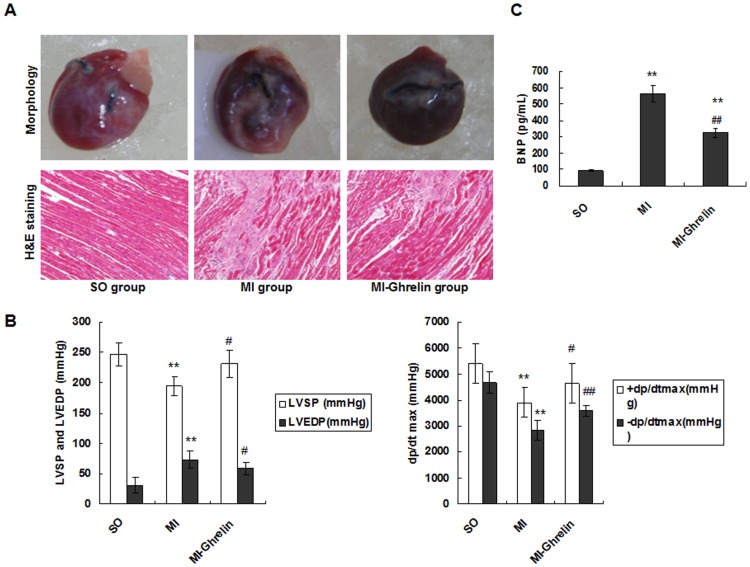
Figure 2. The effect of ghrelin on HF.
(A) Representative images of hearts. Four weeks after ghrelin administration, the heart was removed, and the tissue sections were stained with H&E (×200 magnification). (B) Hemodynamic index, including ±dp/dtmax, LVEDP, and LVSP. +dp/dtmax, maximal rate of the rise in blood pressure in the ventricular chamber; -dp/dtmax, maximal rate of the decline in blood pressure in the ventricular chamber; LVEDP, left ventricular end diastolic pressure; LVSP, left ventricular systolic pressure. (C) The levels of plasma BNP. The data are presented as the means ± SD. **P<0.01 vs. SO group; #P<0.05, ##P<0.01 vs. MI group.

