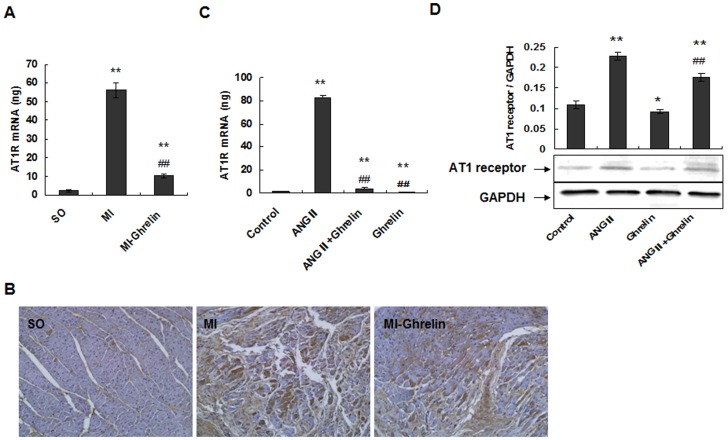
Figure 5. Ghrelin inhibits Ang II-induced cell apoptosis by down-regulating AT1R and thereby preventing HF.
(A) The expression of AT1R mRNA by real-time quantitative PCR. The total RNA of noninfarcted left ventricular tissue was extracted using TRIzol Reagent, and real-time quantitative PCR was performed to determine the AT1R mRNA levels. The data are presented as the means ± SD. **P<0.01 vs. SO group, ##P<0.01 vs. MI group. (B) The expression of cardiac AT1R in rat cardiac tissues by immunohistochemical staining (×200). (C) Real-time quantitative PCR was performed to determine the AT1 receptor mRNA levels in cardiomyocytes. After the addition of 0.1 µmol/L ghrelin, 0.1 µmol/L Ang II, 0.1 µmol/L ghrelin + 0.1 µmol/L Ang II, or culture medium (control), the cardiomyocytes were cultured for 24 hours. Real-time quantitative PCR was performed to determine the mRNA levels. The data are presented as the means ± SD. **P<0.01 vs. the control group; ##P<0.01 vs. the Ang II group. (D) Western blotting was performed to determine AT1 receptor expression. Proteins were extracted from cardiomyocytes, separated by SDS-PAGE, and immunoblotted sequentially with anti-AT1 receptor antibody. The graph shows the result of densitometric quantification of the AT1 receptor protein relative to GAPDH as an internal control. The data are presented as the means ± SD. *P<0.05, **P<0.01 vs. the control group; ##P<0.01 vs. the Ang II group.

