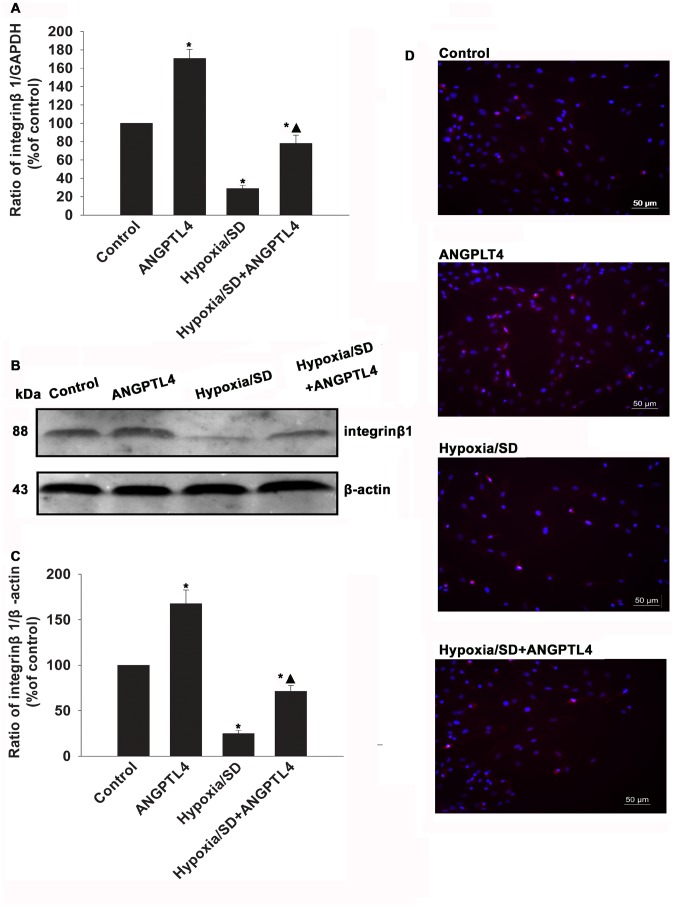
Figure 6. ANGPTL4 influenced expression of integrin β1 in MSCs.
(A to C) mRNA and protein levels of integrin β1 molecules were analyzed by qRT-PCR and western blot analysis as described in the methods. (Each column represents the mean ± SD of three independent experiments; *P<0.05 vs. control; ▴P<0.05 vs. hypoxia/SD). (D) Expression levels of integrin β1 on the MSCs surfacewere analyzed by immunofluorescence assay.

