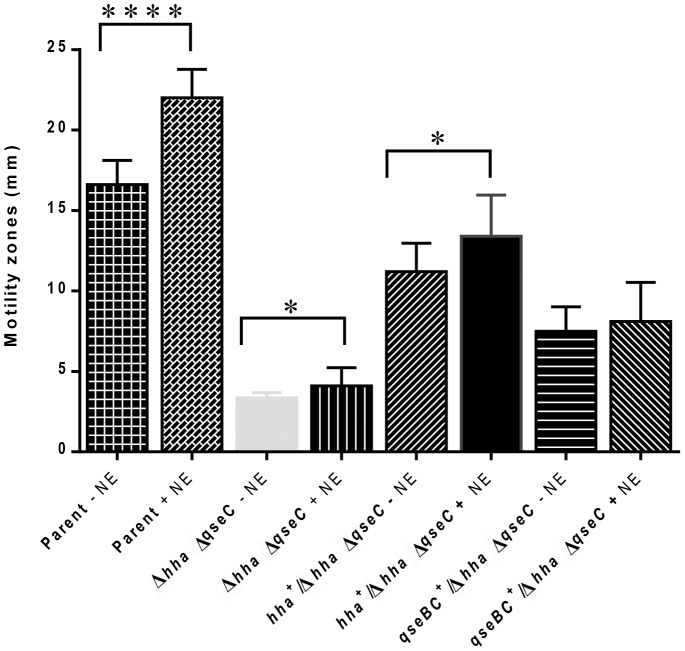
Figure 3. Relative contributions of hha and qseC to the regulation of motility.
Relative motility of a hha qseC double deletion mutant was compared to the same mutant complemented with a plasmid-cloned copy of hha or qseC on the soft-agar motility plates lacking or supplemented with norepinephrine (NE). The motility zones produced after an overnight incubation at 37°C are shown as bar graphs. The bars represent mean diameters of the motility zones (mm) ± SEM computed from the three independent bacterial cultures of each strain. Significance of the difference in motility of a strain grown on a soft-agar motility medium lacking or containing NE is shown by asterisks above the brackets. * (p = 0.05); **** (p = <0.0001).

