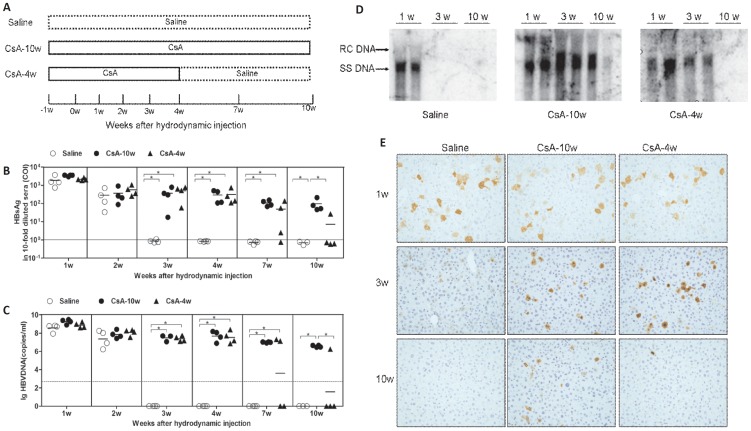
Figure 3. HBV replication and gene expression in CsA- or saline-treated mice after HI.
(A) Schema of the treatment. The mice were treated with saline (Saline) or CsA from 1 week before the HI to 4 weeks (CsA-4w) or 10 weeks (CsA-10w) after the HI. The levels of serum HBsAg (B) and HBV DNA (C) in the mice at the indicated time points were detected. The cut off values of HBsAg and HBV DNA are displayed as solid and dashed lines, respectively. Liver samples were collected from the mice (n≥3) at the indicated time points. The HBV replicative intermediates (D) and HBcAg (E) in the liver were analyzed by Southern blotting and IHC (magnification 200×), respectively.

