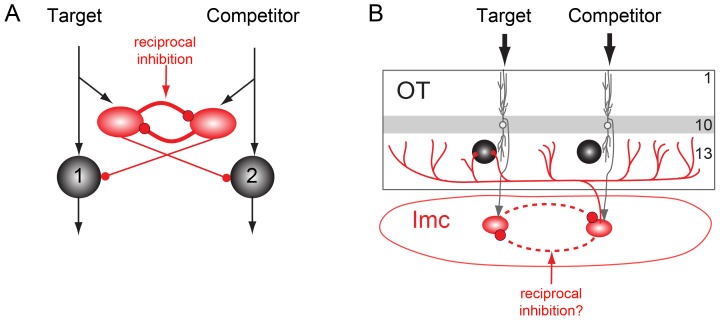
Figure 1. Reciprocal inhibition of inhibition in the midbrain selection network.
A) Computational model: Schematic of a lateral inhibitory circuit with long-range projections from the inhibitory units (red ovals) to the excitatory output units (black circles). Black arrows indicate excitatory connections, red circles represent inhibitory connections. One channel (1) represents a target stimulus; the other (2) represents a competitor stimulus. Reciprocal feedback inhibition between inhibitory units is depicted with solid lines. Adapted from [2]. B) Anatomy: Schematic of midbrain selection network. Neurons in layer 10 of the OT (white circles, grey dendrites) send topographic projections to Imc neurons (red ovals). Imc neurons send widespread GABAergic projections to neurons in the intermediate/deep layers of the OT (black circles). Putative reciprocal inhibition between spatial channels is depicted with dashed lines.

