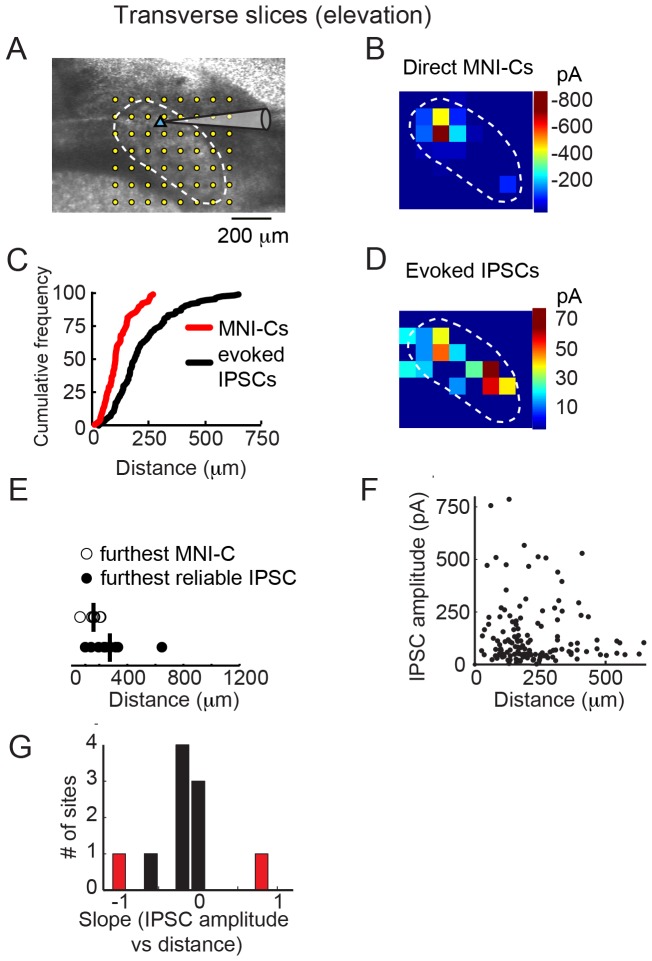
Figure 3. Intra-Imc inhibition in the transverse plane.
A) Image montage of the Imc in the transverse plane. Conventions as in Fig. 2A. B) Map of direct MNI-Cs for the neuron depicted in Fig. 3A. MNI-Cs were evoked only from sites near the recorded neuron. Conventions as in Fig. 2C. C) Cumulative frequency plot of MNI-Cs (red, 7 maps from 7 neurons) and IPSCs (black, 10 maps from 10 neurons) recorded in the horizontal plane. Median distance of the distributions (followed by 25th and 75th percentiles) were: MNI-C: 121 µm (70–202 µm), IPSC: 184 µm (127–293 µm). D) Map of evoked IPSCs for the neuron depicted in Fig. 3A. IPSCs were evoked from sites throughout the Imc. E) Distances of the furthest MNI-C or furthest reliable IPSC for Imc neurons recorded in the transverse plane. Mean distance (horizontal line) of MNI-C: 167 µm (n = 7), of IPSC: 276 µm (n = 10). p<0.05, Mann-Whitney U-test. F) Comparison of photostimulation-evoked IPSC magnitude to photostimulation site distance from recorded cell. Large amplitude IPSCs could be evoked from sites proximal to or distal to the recorded neuron. IPSCs from all recordings are shown. G) Histogram of slopes from regressions comparing IPSC amplitude with photostimulation distance for individual maps. Only 2 of 10 regressions were significant (p<0.05; red bars), 1 with slope <0 and 1 with slope >0.

