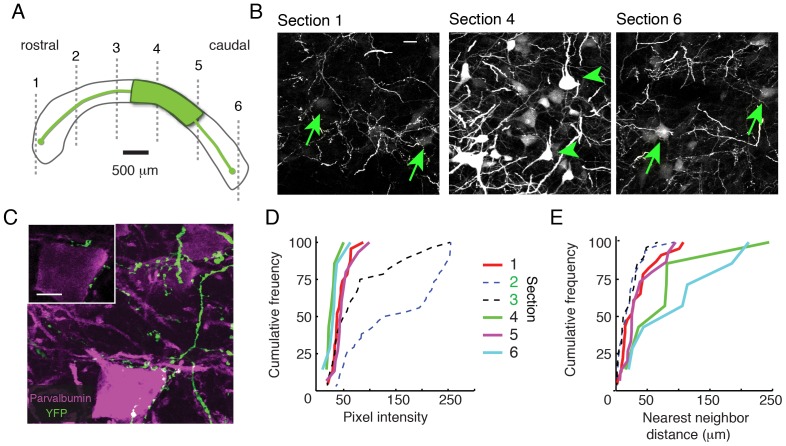
Figure 4. Long-range axonal projections and retrograde labeling within the Imc in vivo.
A) Schematic showing the location of injection of A3V expressing eGFP (green) in the horizontal plane. Grey, dashed lines represent the locations of the transverse sections shown in the following panels. B) eGFP-labeled axons and somata in transverse sections across the rostrocaudal extent of the Imc. Green arrows indicate retrogradely labeled somata observed at the rostral and caudal poles of the Imc (Sections 1 and 6). Green arrowheads indicate directly labeled somata observed only near the injection site (Section 4). C) Maximum projection confocal image of eGFP-labeled boutons (green) surrounding a parvalbumin-immunostained Imc somata (purple). Inset (upper left): single plane confocal image showing close apposition of an eGFP-expressing axon and the Imc soma shown in the full image (bottom right). D) Quantification of pixel intensity for somata at various locations across the rostrocaudal extent of the Imc. Each line represents distribution from a particular section in the transverse plane. A majority of neurons near the injection site (dashed lines) exhibited high eGFP expression, as indicated by high pixel intensity, while those at the distal ends consistently exhibited lower intensity (solid lines). E) Quantification of density of labeled somata at various locations across the rostrocaudal extent of the Imc. The distance of the nearest labeled neighbor was determined for each neuron in a field of view. Neurons near the injection site (dashed lines) had close near-neighbors, suggesting a dense distribution of labeled neurons. Neurons at the distal ends (solid lines) had more distant near-neighbors, suggesting a sparse distribution of labeled neurons.

