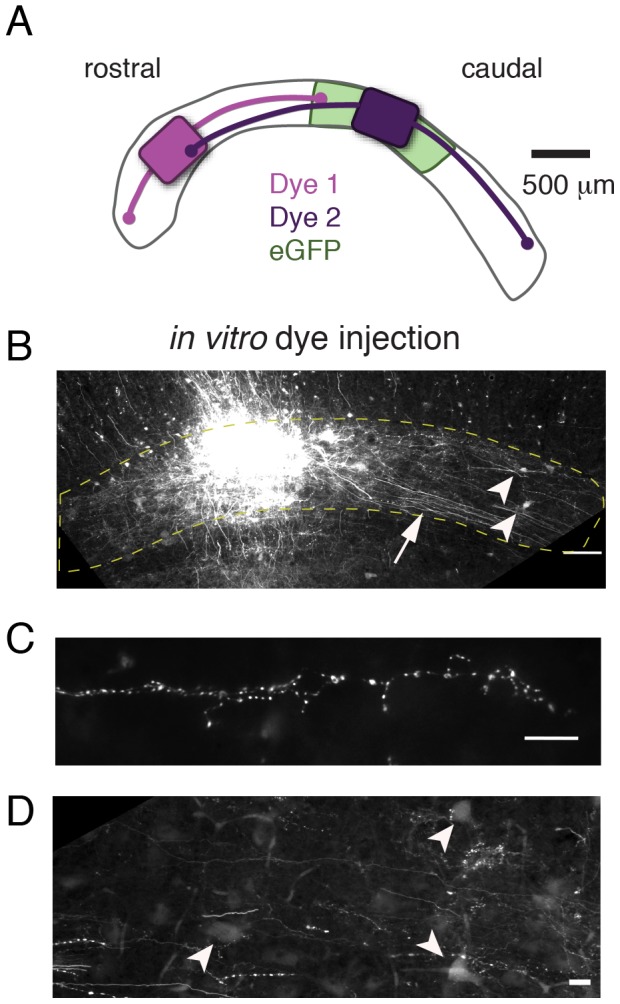
Figure 5. In vitro labeling of long-range axonal projections and somata in the horizontal plane.

A) Schematic showing the locations of injections of fluororuby dye (purple and lavender) along with approximate distances of observed axonal projections (curved lines). Light green shading indicates location of eGFP injection shown in Fig. 4 for context; virus and fluororuby injections were not performed in the same tissue. B) Low power image of the Imc, cut in the horizontal plane, following an injection of fluororuby. Horizontally oriented axons (arrow) can be observed streaming from the injection site. Retrogradely labeled somata are apparent away from the injection site (arrowheads). Scale bar = 100 µm. C) High power image of labeled axons, distant from the dye injection site. Boutons can be observed along the axon. Scale bar = 10 µm. D) High power image of retrogradely labeled somata (arrowheads), distant from the dye injection site. Scale bar = 10 µm.
