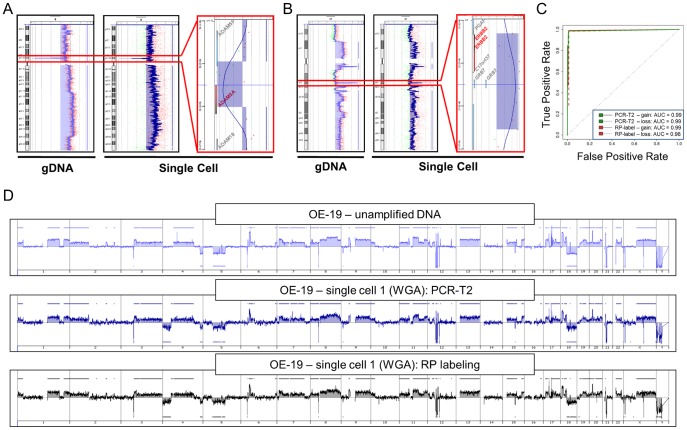
Figure 2. PCR-based PCR-T2 labeling technique vs. RP labeling.
A) Chromosome specific aCGH profiles of chromosome 8. B) Chromosome specific aCGH profiles of 17. Each panel represents aCGH profiles generated with unamplified and single-cell gDNA (PCR-T2 labeling) – left and middle plot, respectively. The right plot of each panel represents magnified graphical overview of genes within loci recognized as aberrant. C) ROC-curves (corresponding to profiles presented in panel A) depicting the accuracy of single cell aCGH assay for PCR-T2 or RP labeling. The array CGH profile generated using unamplified gDNA of OE-19 cells was taken as reference for the comparison. ROC analysis was performed on a genome-wide basis. D) Genome wide aCGH profiles of OE-19 cells generated using unamplified gDNA (upper panel) and a single-cell WGA product labeled with PCR-T2 (middle panel) or RP labeling approach.

