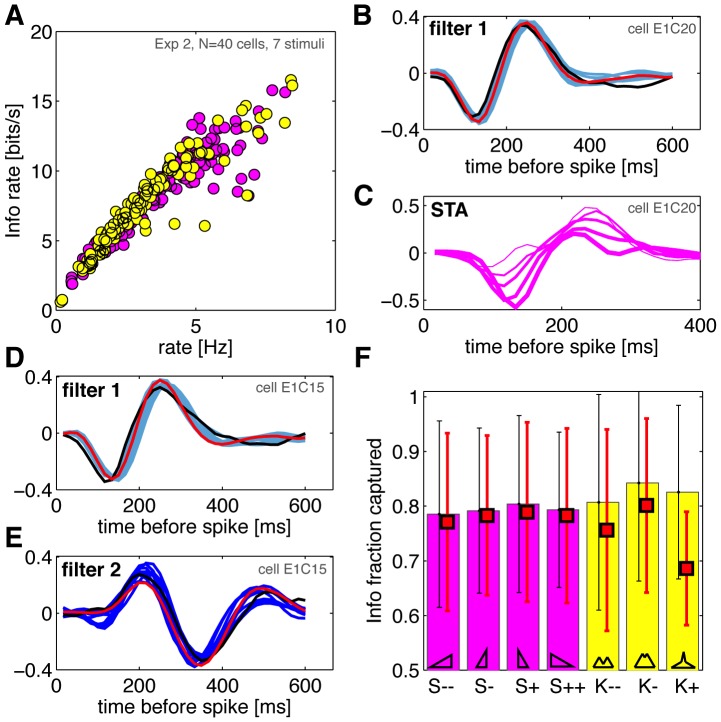
Figure 3. Linear filters and higher-order statistics stimuli in retinal ganglion cells.
A) Estimated information rate (see Methods) as a function of the mean firing rate. Each dot represents one of the 40 cells in experiment 2 exposed to one of the 7 HOS conditions (skewed stimuli in magenta, kurtotic in yellow). The growth in information is slightly sublinear, with no obvious systematic dependence on the stimulus type. B) A cell whose behavior is captured well by a single linear filter. Shown in light blue are the filters for all 9 (2 Gaussian, 7 HOS) stimuli reconstructed using maximally informative dimensions; in black the spike-triggered average computed on the Gaussian stimulus C++; in red, a single global filter inferred using MID across all stimulus conditions simultaneously. C) Biased STA filter estimates for 5 skewed stimuli (thicker lines mean increasing skewness) for the same cell as in B (note the difference in the time axis). D,E) A cell whose behavior is described well by two linear filters (light blue = the most informative dimension; dark blue = the second most-informative dimension). Other symbols the same as in B). F) Information captured by two filters (across stimuli, horizontal axis), as a fraction of the total information per spike; mean (bars) and interquantile range error bars across 40 cells in experiment 2. The average performance of global models (the same pair of filters across all stimuli for each cell) is plotted as red squares.

