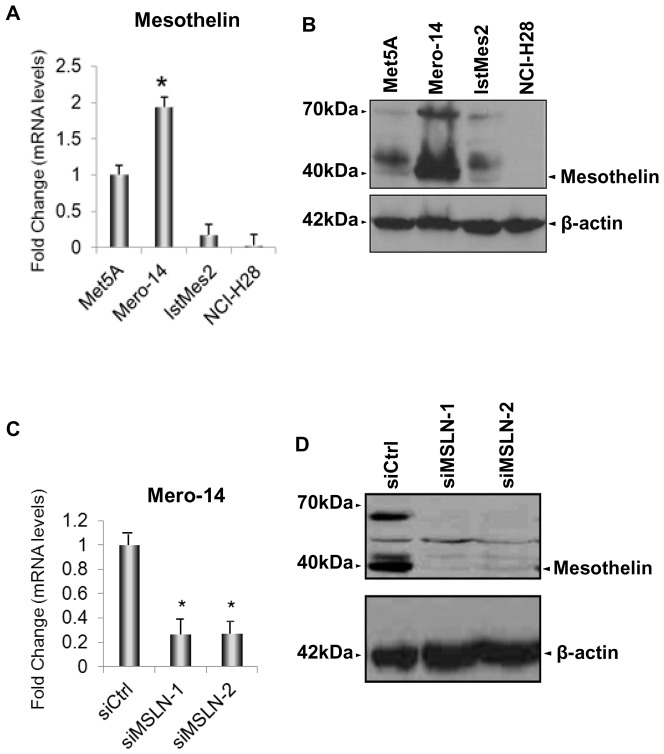
Figure 1. Expression levels of MSLN in human MPM cell lines and Met5A.
A. RT-qPCR showing the mRNA expression levels of MSLN measured on MPM cell lines and related to Met5A cells (set to 1). RPLP0, HPRT, and TBP were used for normalization. Error bars show the standard error of the mean (SEM) from three independent experiments, each performed in triplicate. Mero-14 cells showed the highest expression levels of MSLN (P = 0.02). B. The protein levels of MSLN in Met5A, Mero-14, IstMes2, and NCI-H28 cells. β-actin was used as reference. The protein levels were confirmed by two independent experiments. MSLN is shown as a band at 40 kDa. C. RT-qPCR showing the endogenous mRNA expression levels of MSLN in Mero-14 cells, related to their own siCtrl (set to 1). RPLP0, HPRT, and TBP were used for normalization. Error bars are SEM, from three independent experiments, each performed in triplicate. The siRNA chosen for the analysis is: siMSLN-1 (40 nM; *P = 0.002) active on Mero-14 cells. D. Protein levels of MSLN (shown as a band at 40 kDa) after depletion with siMSLN-1 and -2 (40 nM). β-actin was used as reference. The protein levels were confirmed by three independent experiments.

