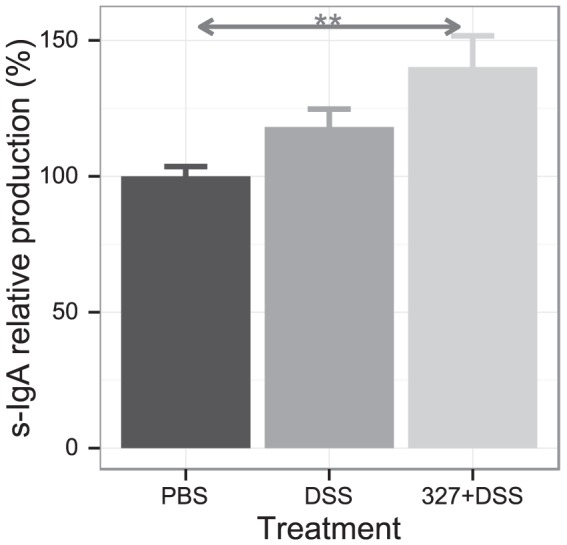
Figure 3. Secretory IgA levels after DSS-induced colitis.

Feces were collected and total sIgA was measured by ELISA. PBS, control without bacteria or DSS; DSS, DSS only, without bacteria; 327+DSS, DSS plus Lb CNRZ327. 100 (the average amount observed in the PBS control group) corresponds to the range of 61.5 to 126 pg/mL. Bars represent the mean ± SEM calculated across three independent experiments, with 3 to 10 mice per group in each experiment (combined sample sizes: 15 to 24 mice per treatment). ** = p<0.01.
