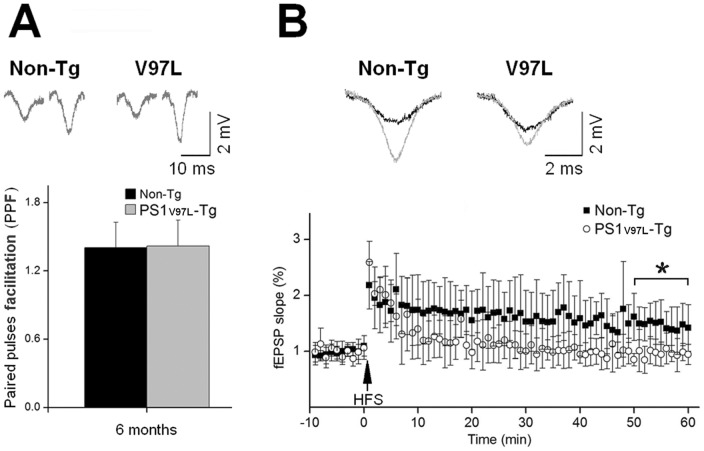
Figure 4. Impairment of synaptic plasticity in hippocampal slices from 6-month-old PS1V97L-Tg mice.
(A) Comparison of PPF in 6-month-old mice. The upper channel shows the typical fEPSP traces derived from paired stimuli with an interpulse interval of 20 ms. The bottom channel shows the PPF in PS1V97L-Tg and Non-Tg mice. (B) Comparison of LTP in 6-month-old mice. The upper channel shows the typical fEPSP traces before (black) and 1 h after (grey) HFS delivery. The bottom channel shows the slopes of the fEPSPs during the 70 min study. The slopes recorded in the last 10 min were analyzed; * indicates a statistically significant difference at p<0.05 (n = 10/group). Note that artifacts are not shown.

