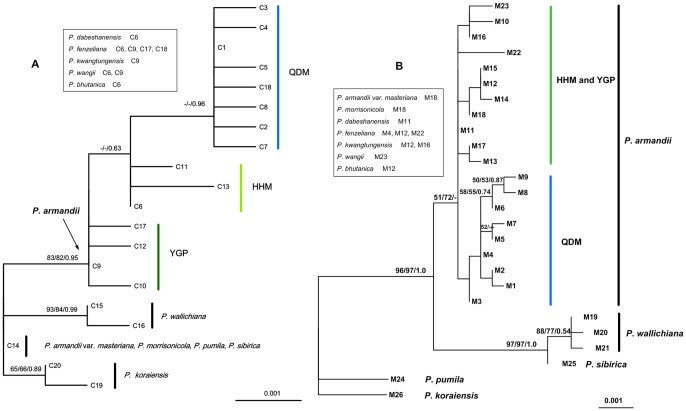
Figure 3. Phylogenetic topography obtained by analysis of chlorotypes (A) and mitotypes (B).
Numbers above the branches are bootstrap values greater than 50% for ML (left) and MP (middle) analyses, and Bayesian posterior probabilities (right). A dash indicates a bootstrap value lower than 50%. The other species included in the Pinus armandii clade are shown in the box.

