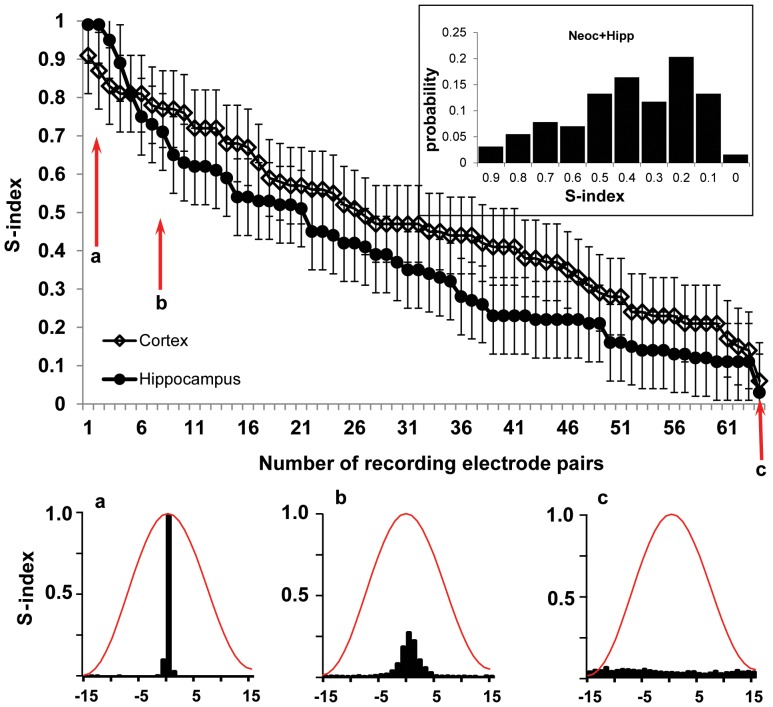
Figure 1. Distribution of the synchronicity Index (S-index) ranked from high to low values for zero time lag gamma in the neocortex (open diamonds) and hippocampus (filled circles) for 16 animals (n = 128 pairs).
The recording sites were separated 1.5– a probability of distribution of the S-indexes. The blue line indicates the median of the data (0.42) and the dashed box outlines the area between 5th and 95th percentiles. a, b, and c – examples of perievent histograms for the S-index equal correspondingly 1.0; 0.73 and 0.05. The red line is the normalized shape of a gamma event.

