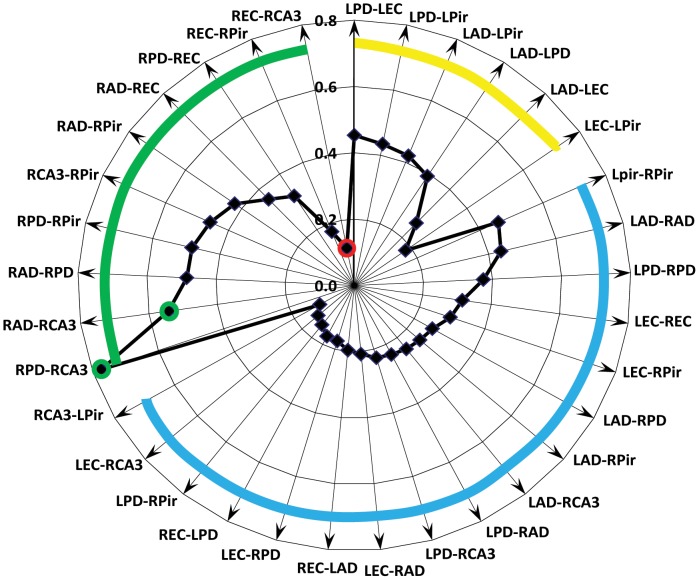
Figure 2. Radar graph illustrating the average connectivity index between different brain areas during the Resting state (n = 11).
The green circles indicates the highest (>0.5) values of the connectivity index, which is between RAD-CA3 and RPD-CA3. They correspond to morphological data of high connectivity within the hippocampal circuitry. The red circle indicates the lowest (<0.2) value of the connectivity index, which is between the right CA3 area and ipsilateral entorhinal cortex. The green thick line outlines the connectivity index between recording pairs in the right hemisphere, yellow in the left, and blue in the interhemispheric recording pairs.

