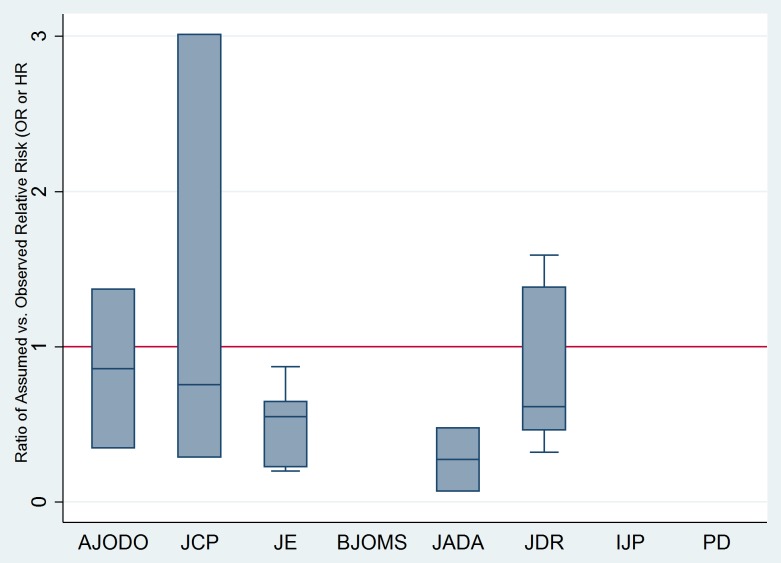
Figure 4. Boxplots of ratio of Odds Ratios (ORs) of assumed compared to observed ORs or HRs for binary, ordinal and time-to-event outcomes from the RCTs where sample size recalculation was feasible (n = 29/121) based on journal of publication.
The horizontal line at 1 indicates perfect agreement between assumed and observed ORs. Median values below 1 indicate optimistic assumptions of variance (smaller than observed) and vice versa.

