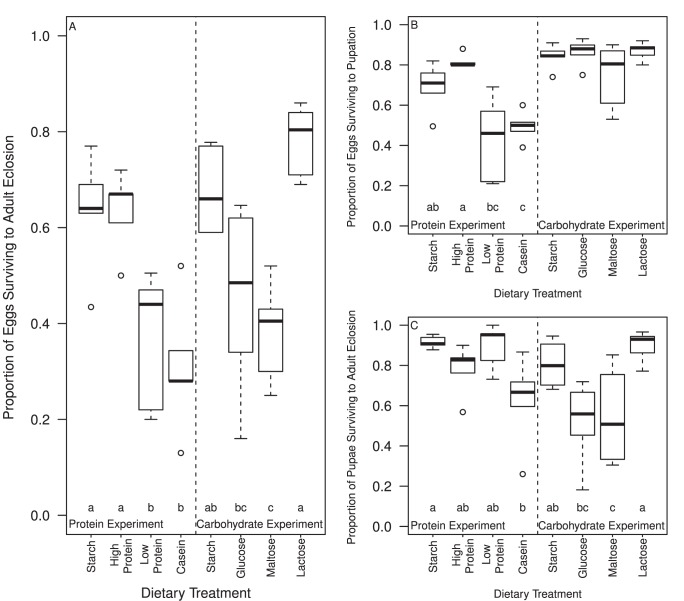
Figure 1. Proportion of Medfly individuals surviving between each developmental stage when reared upon different dietary treatments.
For each panel, on the left are the 4 diets with altered protein content and on the right the 4 diets with altered carbohydrate content. (a) Overall proportion of eggs surviving from egg laying to adult eclosion. (b) Proportion of eggs surviving to pupal formation. (c) Proportion of pupae surviving from initial pupal formation to adult eclosion. Dotted lines represent the range of the data; outer limits of the boxes indicate inter quartile range and the black line at the centre of each box represents the median value. Circles represent outliers. Letters indicate groupings significantly different following post hoc tests (see text for details).

