
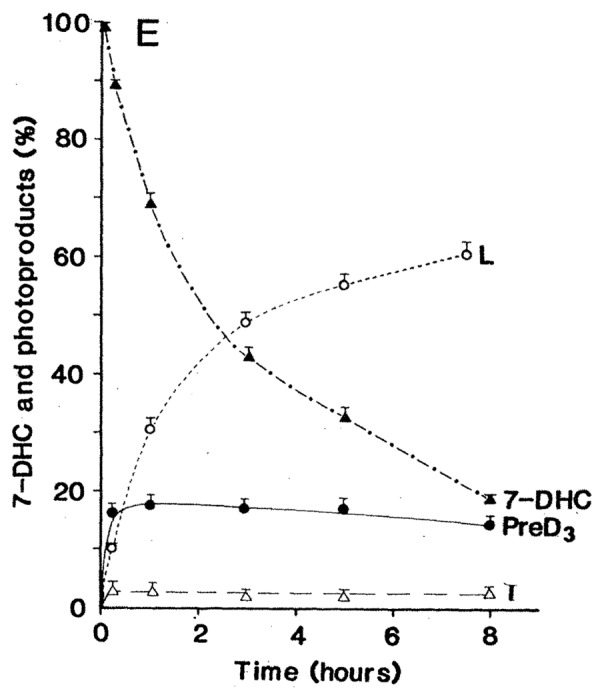
Figure 18. An analysis of the photolysis of 7-dehydrocholesterol (7-DHC) in the basal-cell layer and the appearance of the photoproducts previtamin D3 (Pre-D3), lumisterol3 (L), and tachysterol3 (T) with increasing time of exposure to equatorial simulated solar UV radiation. Bars above data points show the standard error of the mean of three determinations. Holick, copyright 1981. Reproduced with permission.