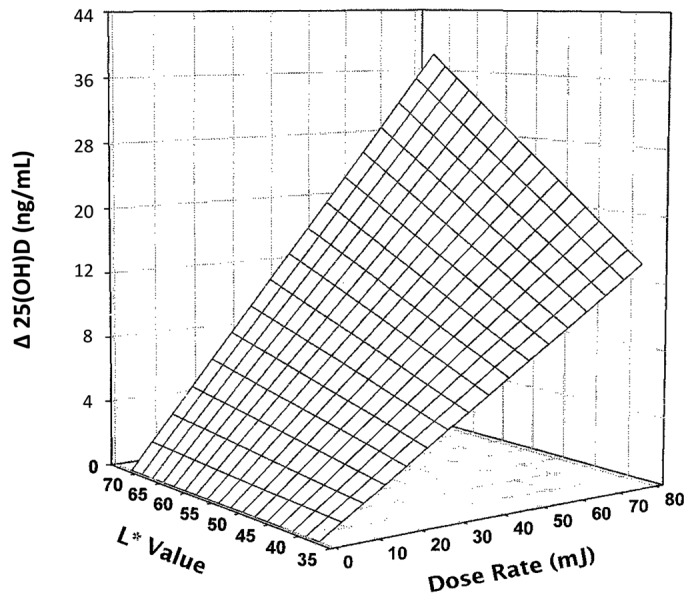
Figure 36. Three-dimensional scatter plot of 4-week serum 25-hydroxyvitamin D response change above baseline expressed as function both of basic skin lightness (L∗) and UV-B dose rate. Surface is a hyperboloid, plotting equation and was fitted to data by least squares regression methods. Heaney, copyright 2006. Reproduced with permission.
