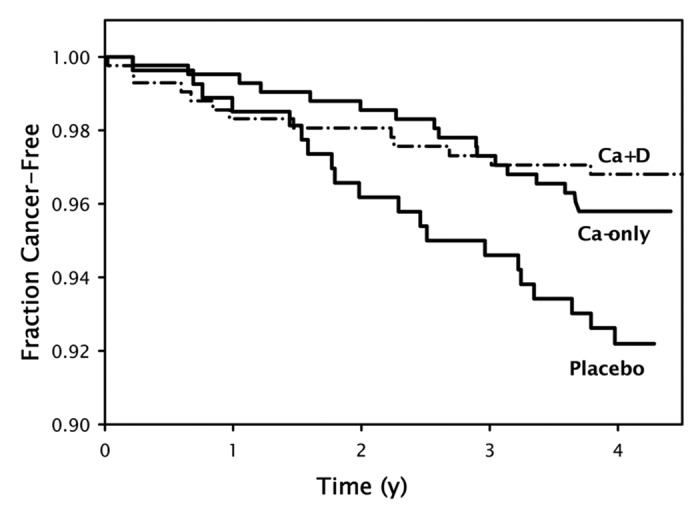
Figure 59. Kaplan-Meier survival curves (i.e., free of cancer) for the 3 treatment groups randomly assigned in the entire cohort of 1179 women. Sample sizes are 288 for the placebo group, 445 for the calcium-only (Ca-only) group, and 446 for the calcium plus vitamin D (Ca + D) group. The survival at the end of study for the Ca + D group is significantly higher than that for placebo, by logistic regression. Copyright Robert P. Heaney, 2006. Reproduced with permission.
