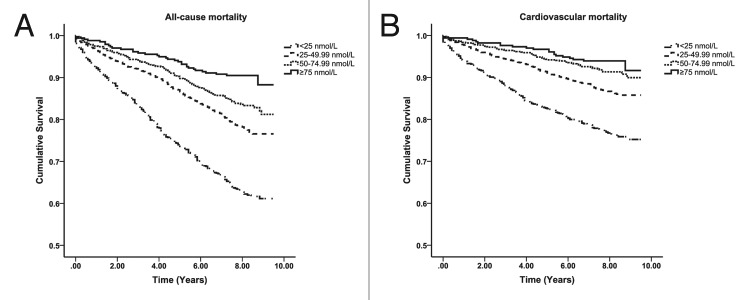
Figure 72. Kaplan-Meier plots for all-cause (left) and cardiovascular mortality (right) according to 25(OH)D groups in those with the metabolic syndrome. Log-rank analysis indicated a significant difference between all 25(OH)D groups (p = 0.001). Reproduced with permission from.188
