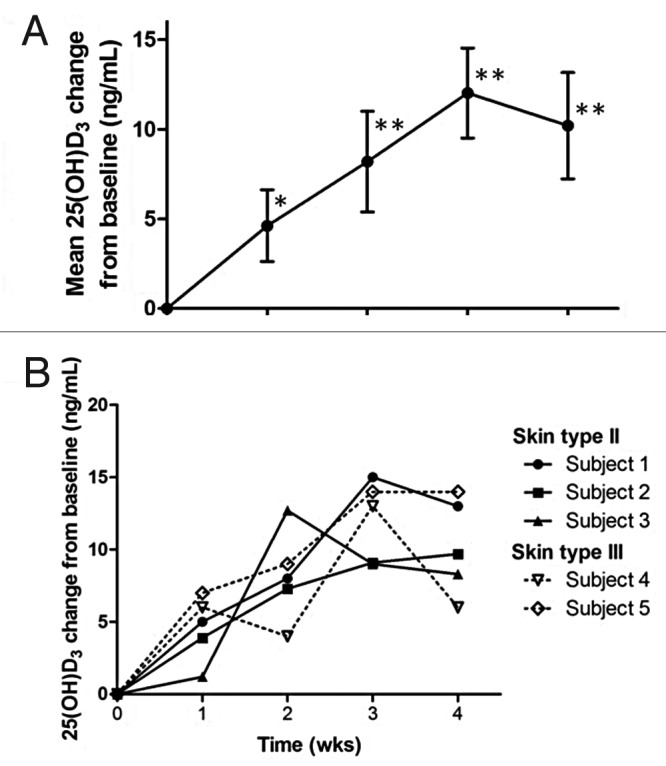
Figure 80. (A) Mean change in serum 25(OH)D3 levels (ng/mL) compared with baseline among the five subjects during the study, error bars represent standard deviation. (*) denotes p < 0.01 and (**) denotes p < 0.005 compared with baseline serum 25(OH)D3. (B) Changes in serum 25(OH)D3 (ng/mL) in each individual subject compared with baseline. Reproduced with permission from.229
