
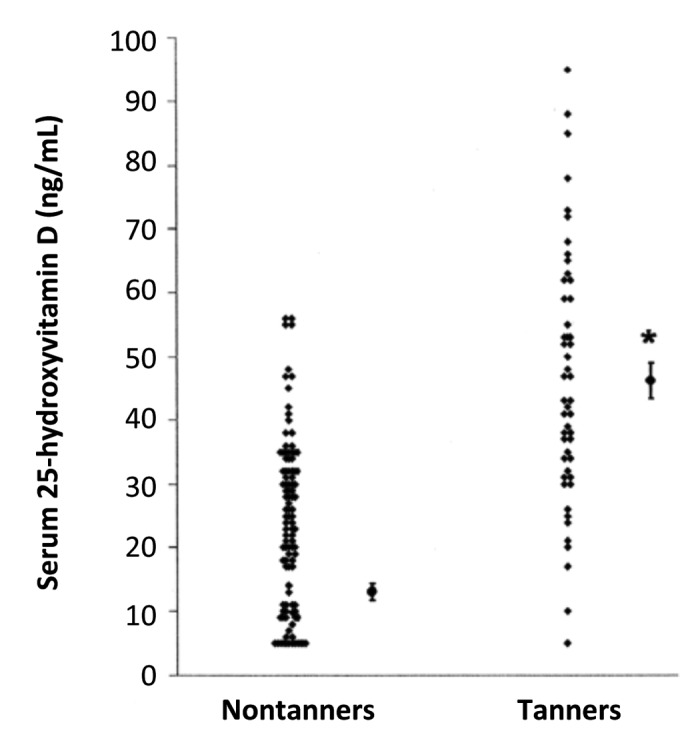
Figure 82. Mean (± SEM) serum 25-hydroxyvitamin D concentrations in tanners and nontanners. Single points for each category are means ± SEMS. *Significantly different from nontanners, p < 0.001. Reproduced with permission from.231
Official websites use .gov
A
.gov website belongs to an official
government organization in the United States.
Secure .gov websites use HTTPS
A lock (
) or https:// means you've safely
connected to the .gov website. Share sensitive
information only on official, secure websites.
Figure 82. Mean (± SEM) serum 25-hydroxyvitamin D concentrations in tanners and nontanners. Single points for each category are means ± SEMS. *Significantly different from nontanners, p < 0.001. Reproduced with permission from.231