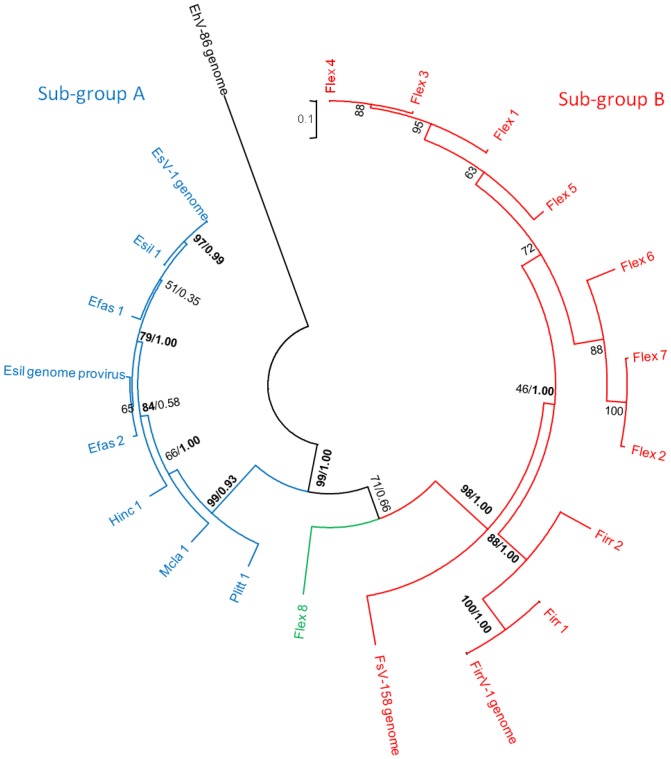
Figure 3. Maximum Likelihood analysis between variants of the phaeoviral sequences of DNA polymerase.
Single value node labels represent ML bootstrap values. Where nodes are labelled with two values, this indicates that both ML and Bayesian topologies agree (whole numbers represent ML bootstrap values, decimals indicate Bayesian posterior probability). Sub-group A viruses are labelled in blue, sub-group B viruses are red and the intermediate Flex virus variant is green. Bold values are those greater than 75% bootstrap or probability.

