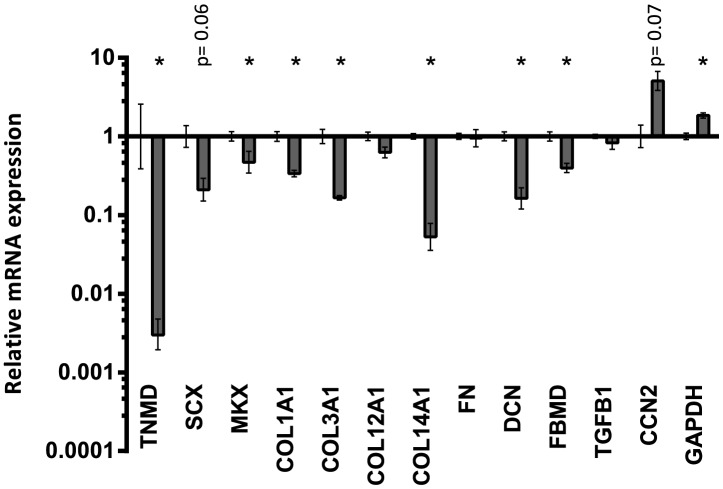
Figure 2. Comparison between 2D monolayer and 3D tendon-constructs under static tension.
The 3D tendon-construct is set as baseline, and mRNA expression of tendon cells grown on 2D monolayer is shown relative to the 3D tendon construct. Significant changes are indicated by *. Data presented on a logarithmic y scale baseline as geometric means ± SEM with 3D tendon-construct as baseline (n = 5).

