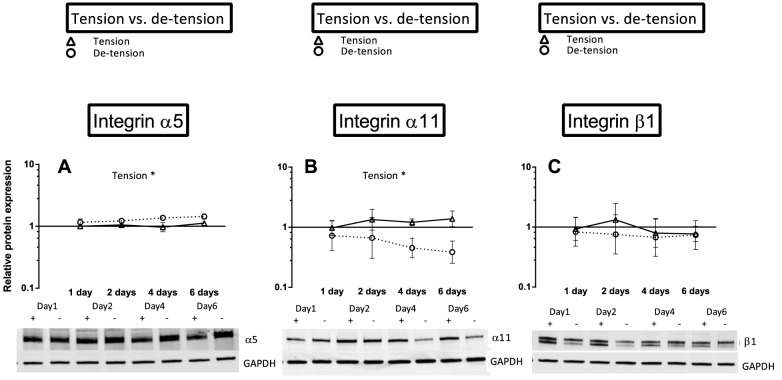
Figure 8. Overview over the effect of de-tensioning on protein expression of different integrin subunits.
A) Effect of de-tensioning on integrin sub-unit α5, B) Effect of de-tensioning on integrin sub-unit α11, C) Effect of de-tensioning on integrin sub-unit β1. The data are presented on a logarithmic y scale as geometric means ± SD (n = 3) where Tension Day 1 is baseline. Significant 2-way RM ANOVA (tension*time) main effects written above the graphs. Open triangles: 3D tendon-construct under tension, without TGF-β1 supplementation; open circles: 3D tendon-construct de-tensioned, without TGF-β1 supplementation. Below the graphs, representative western blots are shown (+/- tension).

