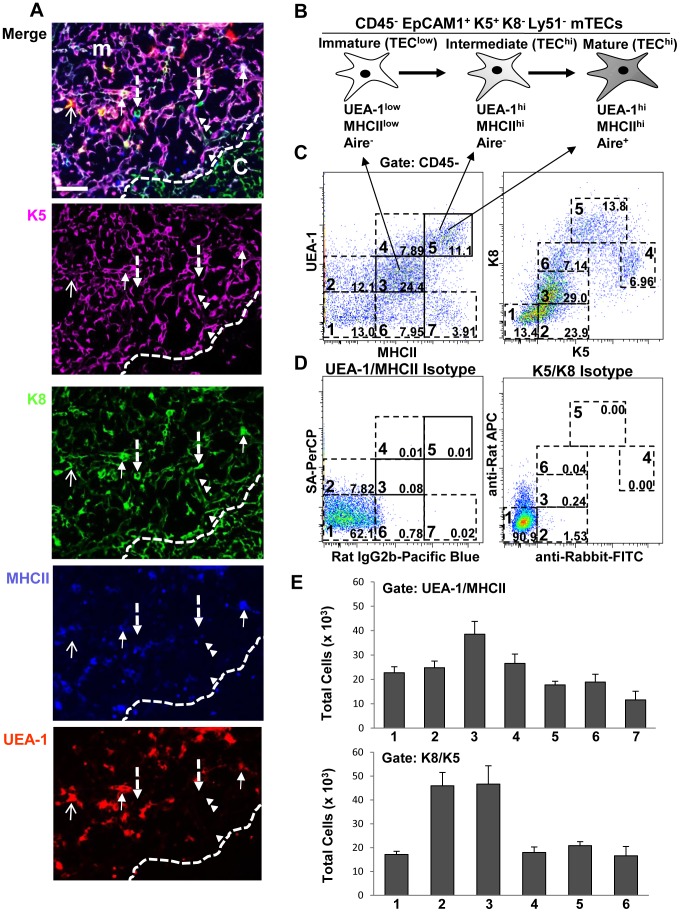
Figure 1. The thymic medulla contains several distinct TEC populations.
(A) Frozen thymic sections from ∼8-week-old mice were stained with K5, K8, MHCII and UEA-1. Arrows point to different TEC subsets as described in the text. Scale bar = 50 µm. (B) Schematic representation of known subsets of mTECs defined by expression/binding levels of MHCII, Aire and UEA-1. (C) Purified thymic epithelial cells from ∼8-week-old mice were stained with anti-CD45, -MHCII, -K5 and -K8 antibodies and biotinylated UEA-1, and analyzed by flow cytometry. Seven populations based on UEA-1 binding and MHCII expression (left dot plot) and six populations based on K5 and K8 expression levels were identified (right dot plot). (D) Isotype controls for UEA, MHCII, K8 and K5 were included in the experiment as shown. (E) The total numbers of the populations within the different gates of UEA/MHCII (1–7) and K8/K5 (1–6) dot plots were quantified by flow cytometry. Bar graphs represent the mean+Standard Error of the Mean (SEM). n = 12, results in C–E were pooled from at least three independent experiments.

