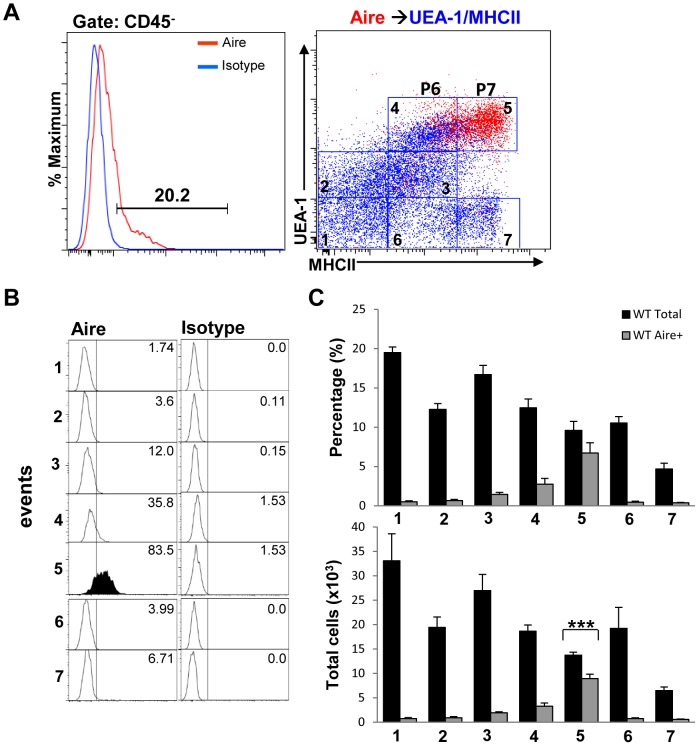
Figure 4. Aire expression is upregulated in the mature TEChi cell subset.
(A) Aire-expressing cells within the CD45− gate were overlaid onto UEA-1/MHCII dot plots of TEC suspensions (right panel, red dots). (B) Aire expression levels within each cell population gated on the UEA/MHCII dot plot in 4A were analyzed by flow cytometry on histograms. (C) The percentages and total numbers of Aire+ cells within the different UEA-1/MHCII-gated populations (1–7) were determined by flow cytometry. Bar graphs represent mean+SEM with n = 10 from 3 different experiments. (D) Table shows the name designations of the different subsets based on expression levels of all markers tested.

