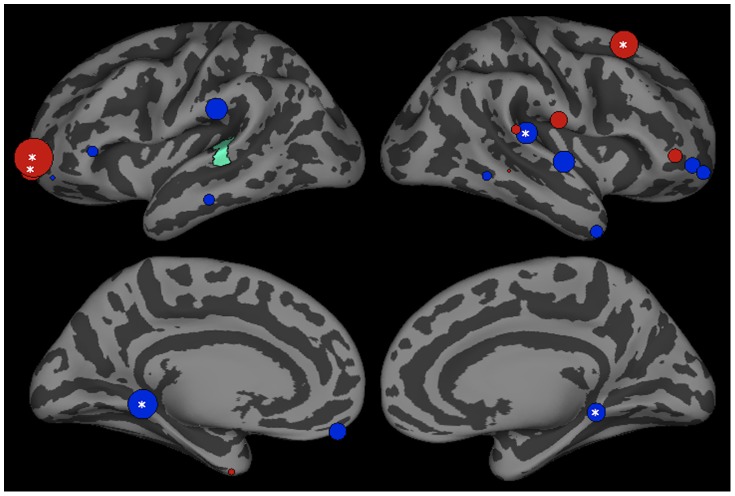
Figure 4. Bottom-up influences by left posterior STG (green) between 200–400 ms after stimulus onset in trials producing phonotactic bias consistent (legal) and inconsistent (illegal) phoneme categorization.
Bubble size indexes the relative strength of Granger influences (number of time points that show GCI values with p<0.05) of ROIs on left pSTG activation. Regions showing stronger bias consistent>bias inconsistent trials are shown in blue, and bias inconsistent>consistent are shown in red.

