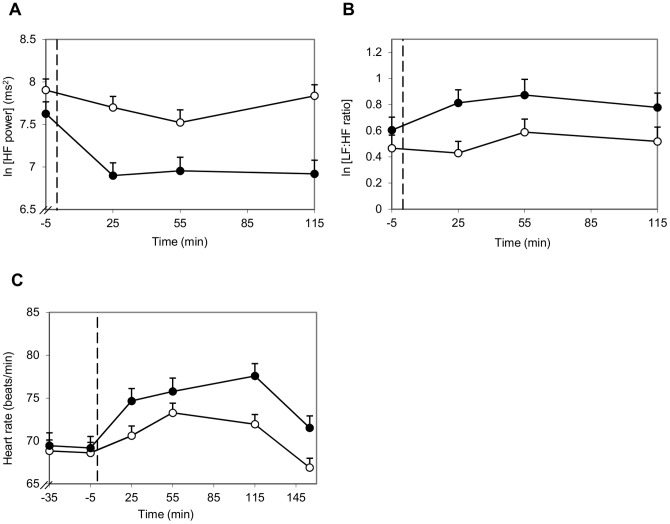
Figure 6. Influence of alcohol on HF power (A), LF:HF ratio (B) and heart rate (C).
−○− Alcohol-free; −•− Alcohol; - - start alcohol consumption (t = 0). (A) HF power was lower after alcohol consumption compared to no alcohol consumption (at 25 min and 115 min P<0.001, at 55 min P<0.01). (B) LF:HF ratio was higher after alcohol consumption (P<0.001). (C) Heart rate was higher 25 min and 115 min after alcohol consumption compared to no alcohol consumption (P<0.01 and P<0.001, respectively). The heart rate values shown at time point −5, 25, 55 and 115 are averages of the mean heart rates measured during three succeeding 2 min time frames.

