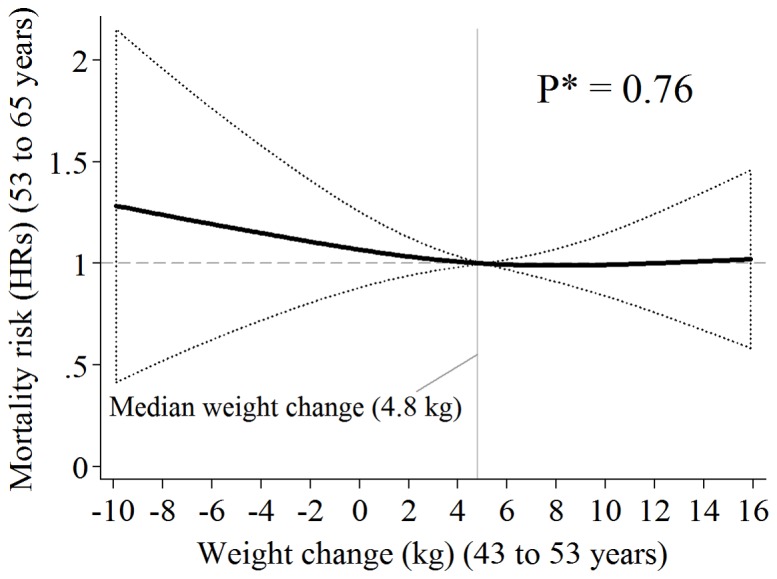
Figure 1. Weight Change (kg) Between 43 and 53 Years and all-Cause Mortality Hazard Ratios (HRs) Between 53 and 65 Years (95% CI bands, dotted lines), in the 1946 British Birth Cohort (n = 2 568; deaths = 141).

HRs are from Fully Adjusted* Cox Regression Using Cubic Splines and Median Weight Change ( = 4.8 Kg) as Reference Point.
