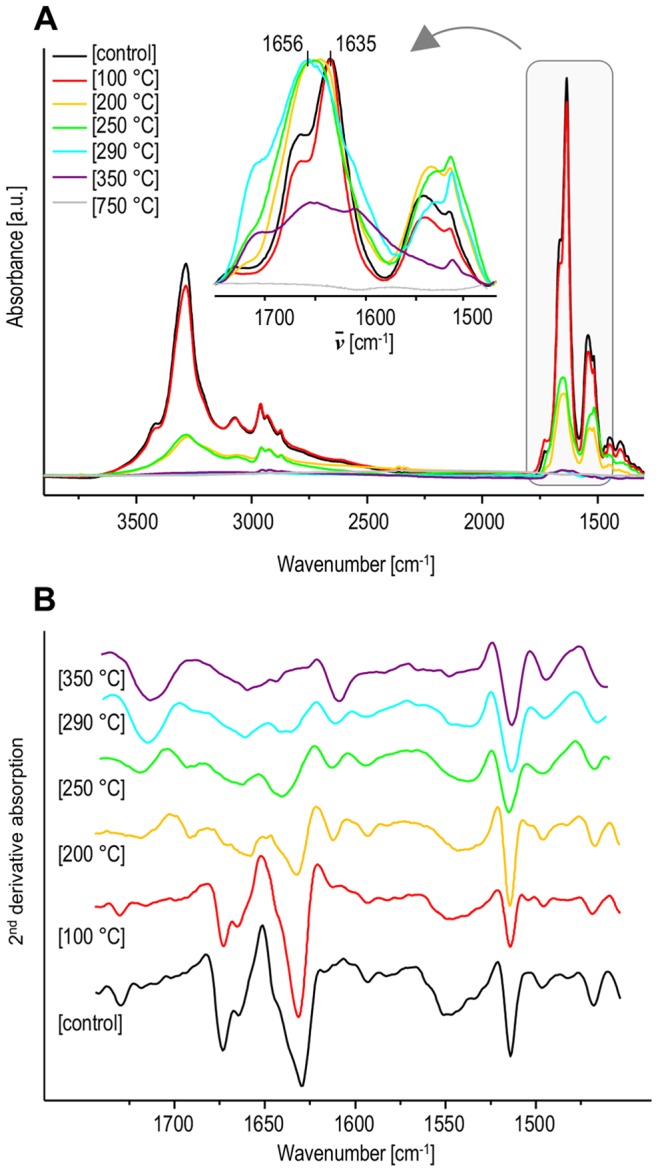
Figure 3. Infrared absorption (A) and second derivative (B) spectra of amyloid fibrils before and after exposure to high temperatures.

Inset in panel A shows normalized spectra in the amide I/II spectral region. Second derivative FT-IR spectra in panel B are shown only for the amide I/II region with omission of featureless 750°C spectrum.
