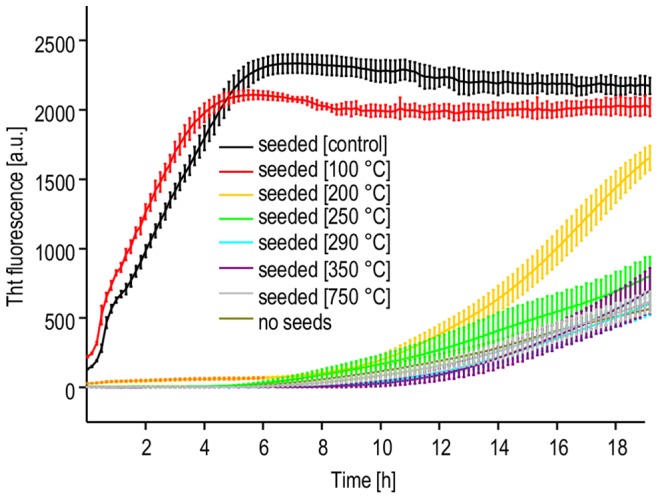
Figure 5. Aggregation kinetics of human insulin seeded at 37°C with fibrils exposed to high temperatures, probed by ThT fluorescence.

Error bars correspond to standard deviations of fluorescence intensity calculated for six microplate wells with identical samples.
