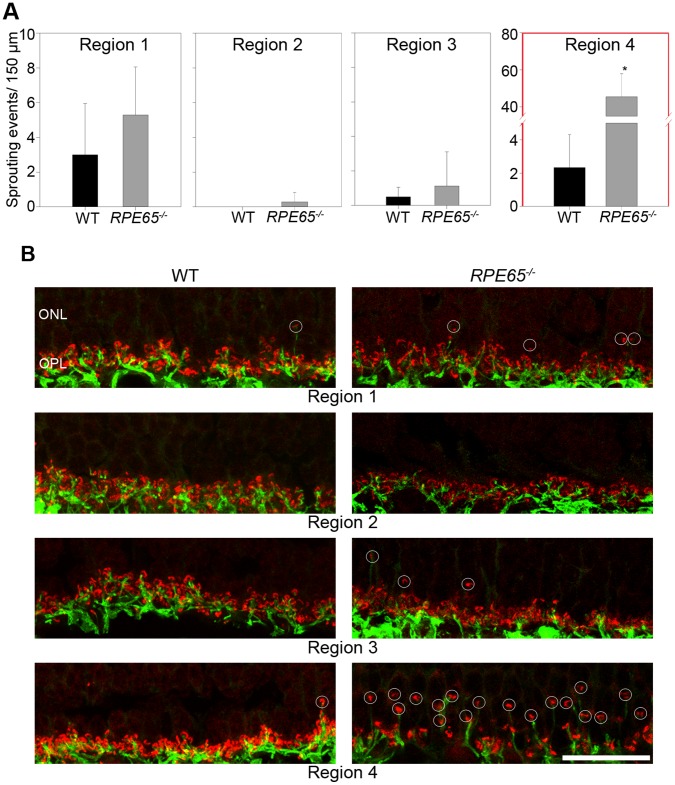
Figure 2. Analysis of sprouting events of rod bipolar cells.
(A) Bar diagrams of the 4 different analyzed regions (see Figure 1B) compared wild type (n = 12 images) and RPE65−/− (n = 24 images). In regions 1–3 there are no essential differences between wild type and mutated dogs. Region 4 displays a statistical significant discrepancy between wild type and RPE65−/− dogs (* p<0,001, student t-test). (B) High resolution confocal images for the analysis. The images are projections of the 4 considered images of a z-stack. The ribbon synapses are marked with CtBP2 (red) and the rod bipolar cells are marked with PKC α (green). The counted sprouting events are marked with white circles. Wild type (WT), outer nuclear layer (ONL), outer plexiform layer (OPL), scale 20 µm.

