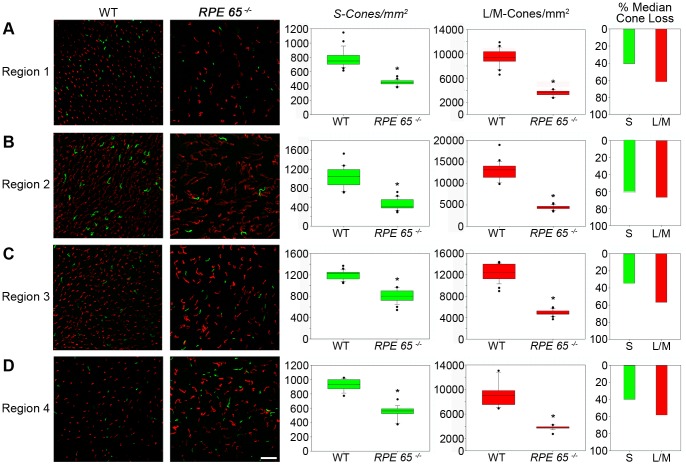
Figure 5. Quantification of cone distribution.
(A–D) S-cone (green) and L/M-cone (red) distribution and quantification in wild-type and mutated canine RPE65−/− retinae. Box blots display the respective distributions of S-cones and L/M-cones in the 4 regions defined in Figure 1. Statistical analysis was done by a Mann Whitney rank sum test, significant values are marked with asterisks * p<0.001. Bar diagrams show the percentage loss of both cone types compared healthy and affected animal medians in the analyzed regions. Both types of cones are significantly reduced in all analyzed regions. L/M-cones in RPE65−/− retinae are not only reduced but look different in shape, thus appearing worm-like. Wild type (WT), scale 25 µm.

