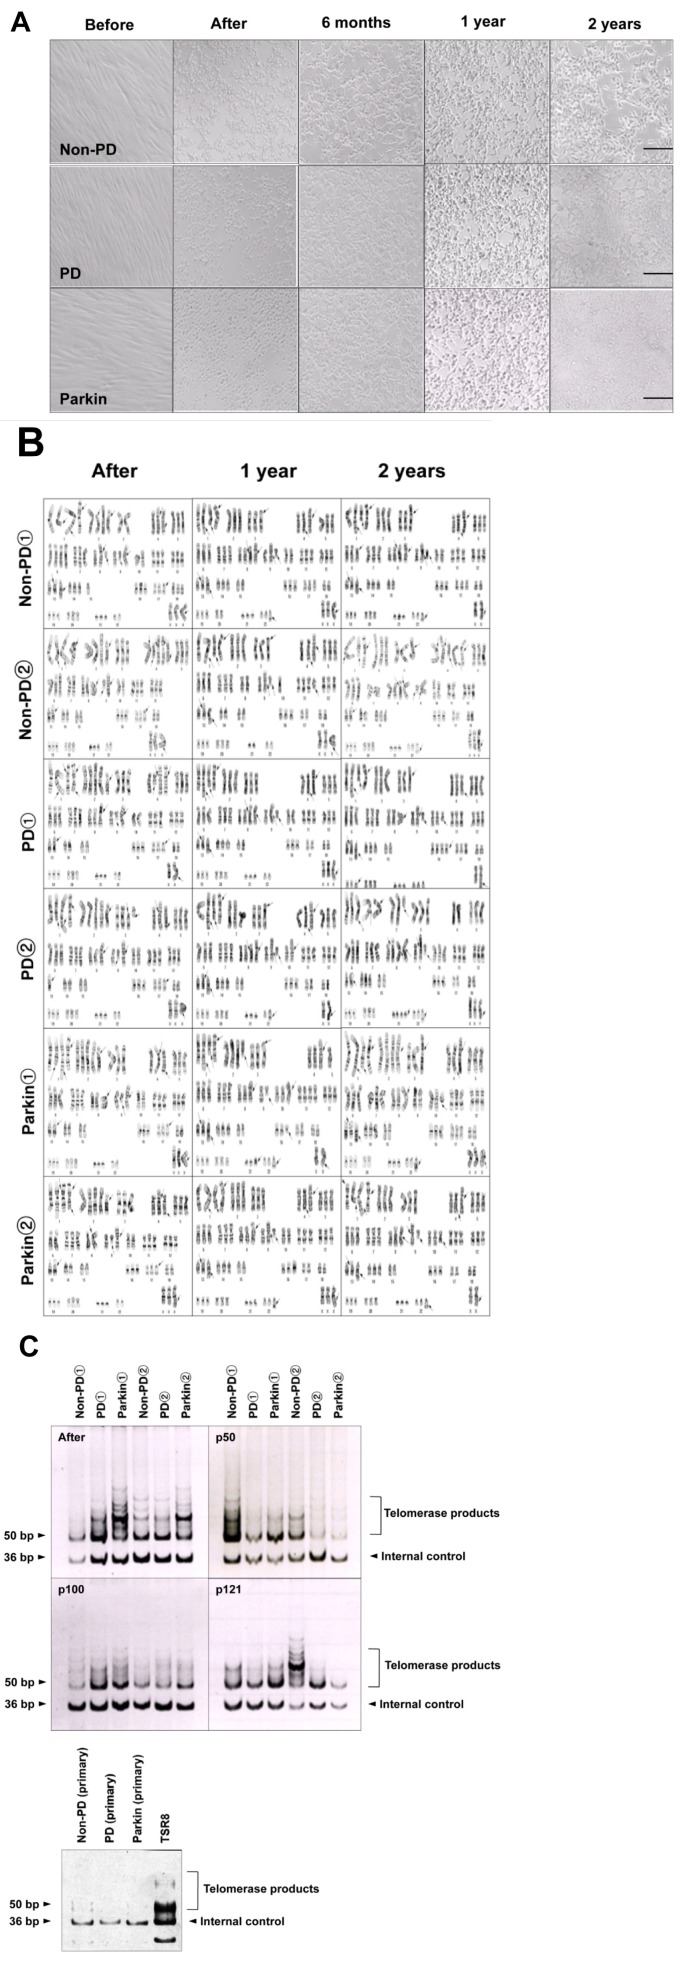
Fig. 1.
Transduction of hTERT telomerase activity resulting in immortalized hAD-MSCs. (A) Morphology of pre- and post-immortal hAD-MSCs. non-PD showing the shape of the cells before and after immortalization, and in the 6-month, 1-year and 2-year cultures; PD showing the shape of the cells before and after immortalization, and in the 6-month, 1-year and 2-year cultures; Parkin showing the shape of cells before and after immortalization, and in the 6-month, 1-year and 2-year cultures. Bar=200 µm. (B) Karyotypic analysis of hAD-MSCs after immortalization and in the 1-year and 2-year cultures was analyzed by GTG banding. The data show the aberrant human karyotype of chromosomes in the immortalized cells. The numbers of altered chromosomes in the karyotypes of non-PD① were 67, 67, 67 and for non-PD② 65, 62, 64; those of PD① were 66, 66, 68 and for PD② 66, 65, 68; those of Parkin① were 66, 65, 67 and for Parkin② 64, 66, 65, after immortalization and in the 1-year and 2-year cultures, respectively. The arrow indicates the aberrant chromosomes in the karyotypes. (C) TRAP assay showing telomerase enzyme activity in the immortalized hAD-MSCs after immortalization, in passage 50, passage 100 and passage 121 cultures. The lanes denoted non-PD①, PD①, Parkin①, non-PD②, PD②, Parkin② represent the immortalized cells individually. The TRAP assay was performed on primary hAD-MSCs. The lanes denoted non-PD, PD, Parkin cells represent the primary cells individually. TSR8 was used as a positive control. A 36 bp band was used as an internal standard. The 50 bp band was the smallest telomerase product.

