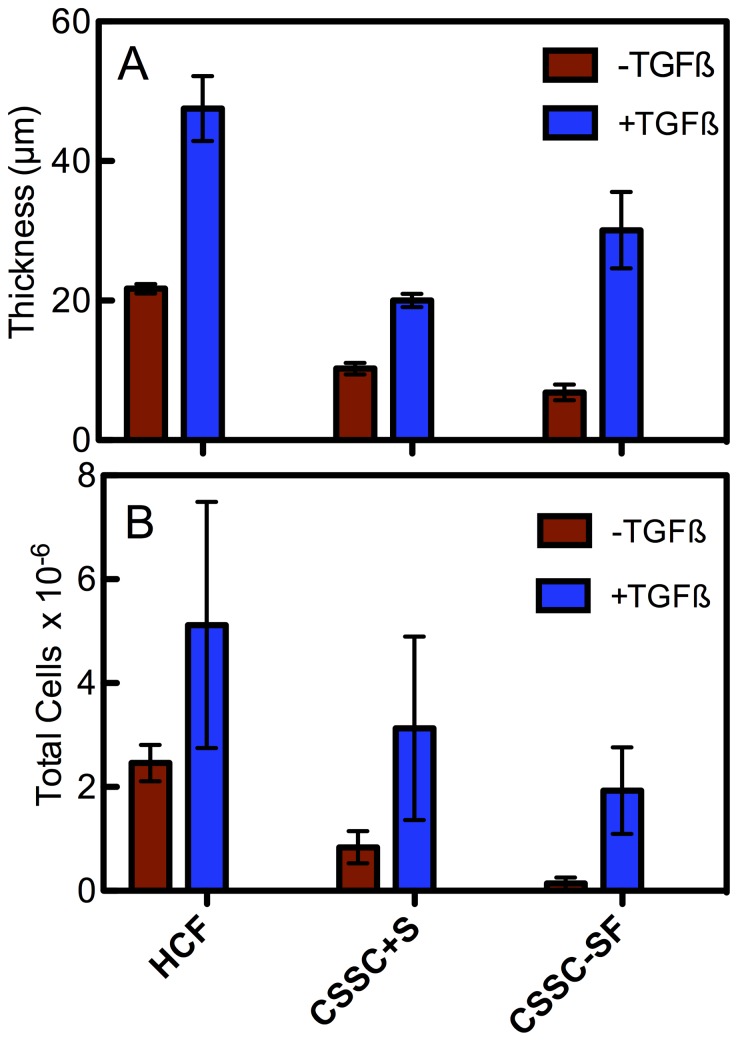
Figure 4. Construct thickness and cellularity.
(A) Shows a graph of construct thickness at 4 weeks. TGF-ß3 treatment led to a significant increase in construct thickness for all conditions (*p<0.05). (B)_Graph of construct's total cells calculated from counts in optical sections of fixed cultures at 4 weeks incubation. Both cell types showed similar numbers ± TGF-ß3 when serum was present. CSSCs without serum had a significantly lower cell density (*p<0.05). Error bars = SD (n = 3).

