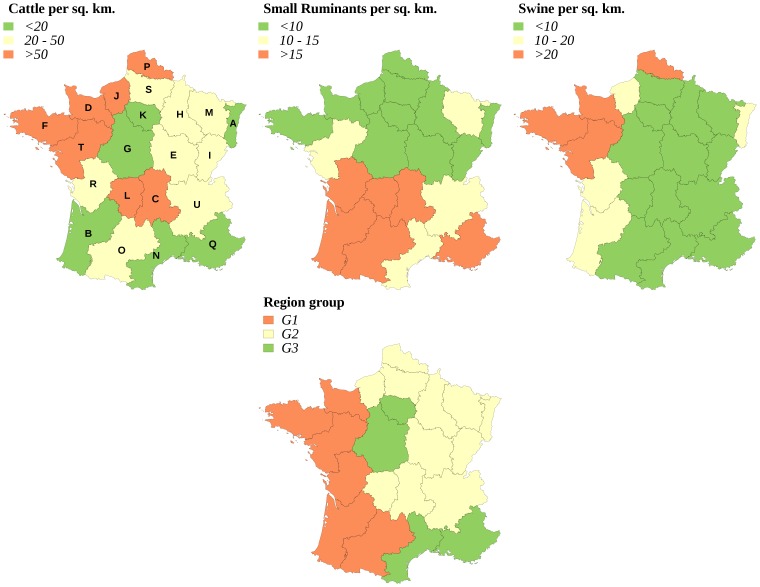
Figure 1. Typology of French regions according to the animal densities of cattle, swine and small ruminants.
Group G1: high cattle and pig density (upper class), high density of small ruminants (upper class) associated with a low or medium cattle and swine density. Group G2: high or medium density of cattle and/or swine associated with a similar or lower density of small ruminants (same class or lower class). Group G3: low densities of cattle and swine. Capital letters on the first map are used to identify the French regions: A: Alsace, B: Aquitaine, C: Auvergne, D: Basse-Normandie, E: Bourgogne, F: Bretagne, G: Centre, H: Champagne-Ardenne, I: Franche-Comté, J: Haute-Normandie, K: Ile-de-France, L: Limousin, M: Lorraine, N: Languedoc-Roussillon, O: Midi-Pyrénées, P: Nord-Pas-de-Calais, Q: Provence-Alpes-Côte d'Azur, R: Poitou-Charentes, S: Picardie, T: Pays-de-Loire, U: Rhône-Alpes.

