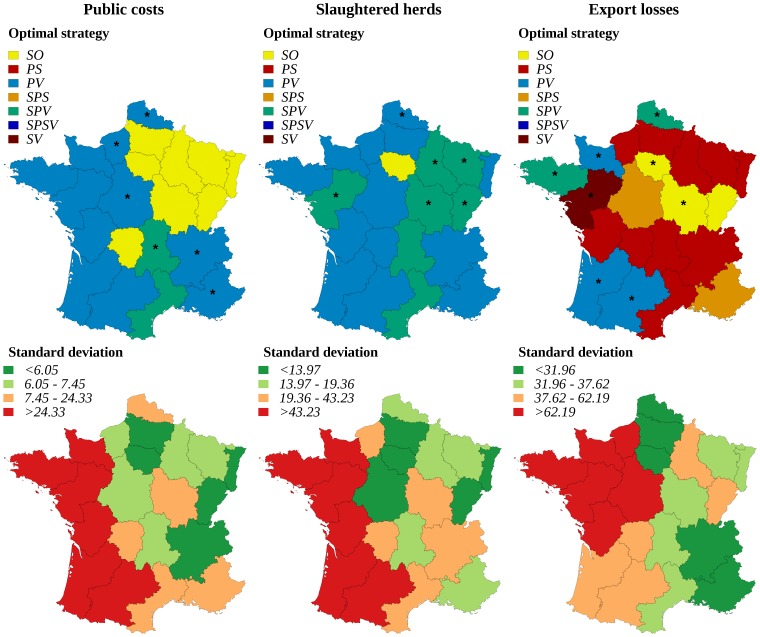
Figure 5. Optimal regional control strategies decided by risk-averse decision-makers, and corresponding standard deviation of the impact.
Optimal control strategies decided at the regional level by risk-averse decision-makers, and corresponding standard deviation of the impact of FMD epizootics for each stakeholder: government (indicator: public costs), agro-food industry (indicator: export losses), and public opinion (indicator: number of slaughtered herds). SO: basic stamping-out strategy, PV: protective vaccination, PS: preemptive slaughter, SPV: selective protective vaccination, SPS: selective preemptive slaughter, SPSV: selective preemptive slaughter and protective vaccination, SV: suppressive vaccination. Public costs and export losses are given in million €. Class bounds were fixed using the quartiles of the distributions. Regions where risk-neutral and risk-averse decision-makers disagree are indicated by stars.

