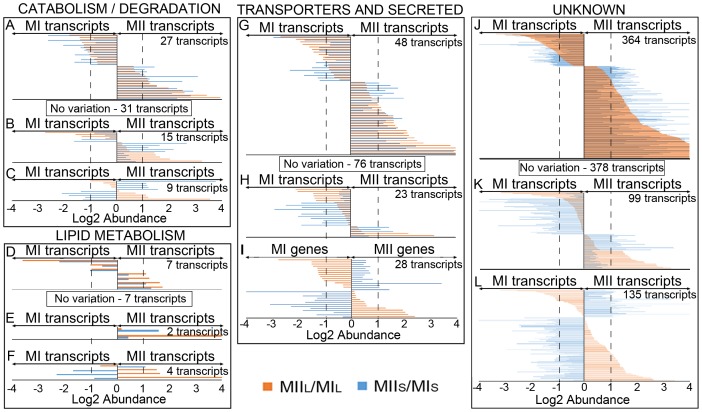
Figure 5. Transcripts abundance values (log2 MII/MI) grouped in functional categories (continuation).
Functional categories: catabolism and degradation; lipid metabolism; transporters and secreted (ABC transporters, transporters and secreted proteins); genes with unknown function. Dashed lines indicate the limit for considering abundance variations significant (log2 abundance ±1).

