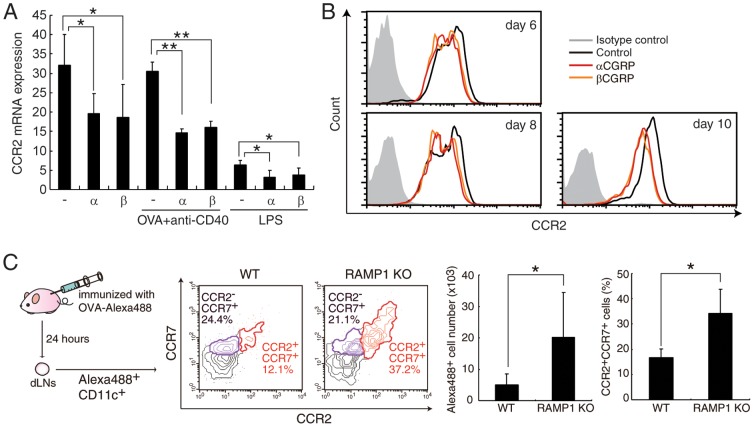
Figure 4. CGRP inhibits CCR2 expression in vitro and in vivo.
(A) The mRNA expression of CCR2 was determined by real-time PCR using untreated-, CD40-stimulated or LPS-stimulated BMDCs. Values are presented as mean ± SD (n = 3). *P<0.05, **P<0.01. (B) BMDCs were differentiated in the presence or absence of CGRP. The expression level of CCR2 protein at each time point was measured by FACS. (C) WT and RAMP1-deficient mice were sensitized with Alexa488-labeled OVA, and migrated DCs in dLNs were analyzed by FACS. Values are presented as mean ± SD (n = 3. *P<0.05.

