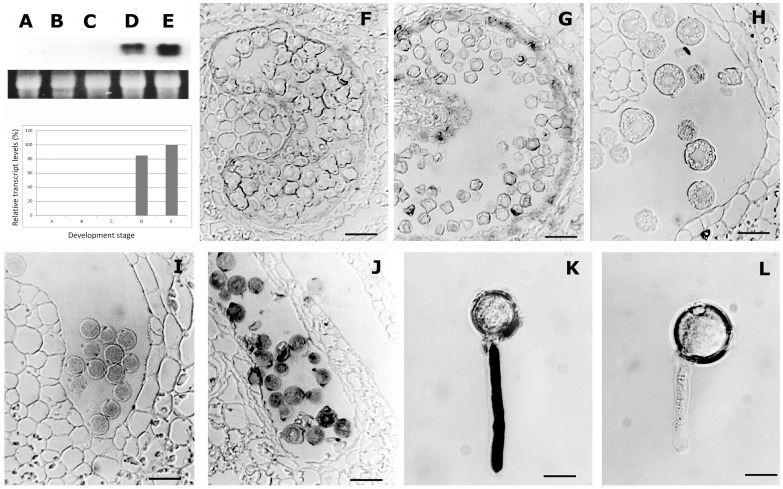
Figure 2. RNA gel blot and in situ hybridization of LePro1 in developing tomato flowers.
The panel on the tope left shows RNA gel blot analysis with hybridization signals on the top and loading control on the bottom. A, B, C, D and E represent anther sections from 3, 6, 9, 12 and 15 mm length flower buds, respectively. F, G, H, I and J are images showing in situ hybridization of DIG- labeled antisense LePro1 to tomato anther sections from flower buds at the same developmental stages as shown in A, B, C, D and E, respectively. K shows germinated pollen hybridized with antisense LePro1 probe, and L represents germinated pollen hybridized with sense LePro1 probe as control (Scale bar = 40 µm in F–J and 20 µm in K and L).

