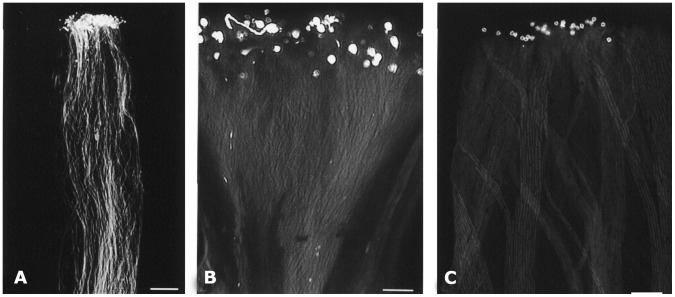
Figure 7. Comparison of in vivo germination of wildtype and antisense pollen.
A, wildtype plants pollen showing normal pollen growth down through the style (Scale bar = 300 µm). B, low pollen germination and growth are seen when A3 pollen is deposited on the A3 stigma (selfing) (Scale bar = 80 µm). C, low pollen growth seen when A3 pollen is deposited on the wildtype plants stigma (crossing) (Scale bar = 160 µm).

