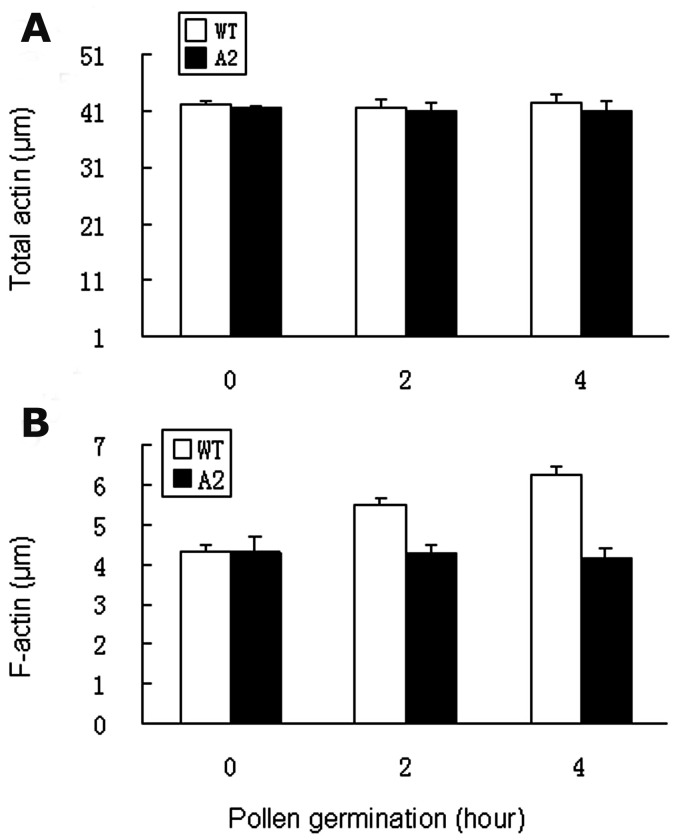
Figure 10. Quantification of total actin and F-actin in antisense (A2) and wildtype (WT) pollen.
A, total actin quantified using anti-actin antibody followed by ELISA at the time course of 0, 2 and 4 hour germination. B, F-actin quantified using rhodamine phalloidin according to Gibbon and Staiger (2000). Error bars represent standard errors of 4 replications (p<0.005).

