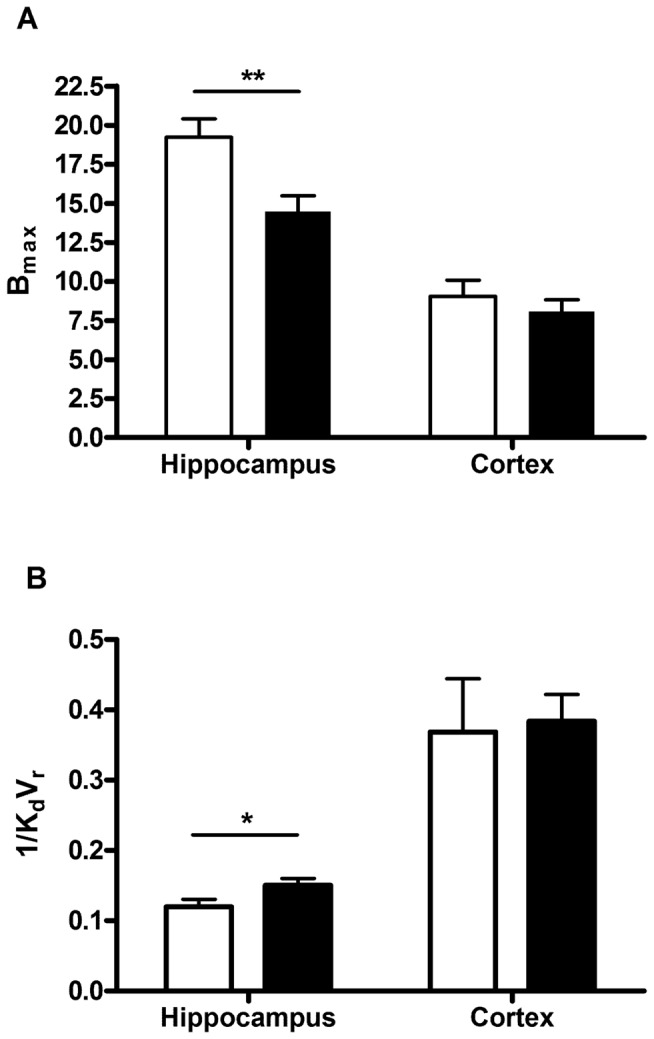
Figure 4. GABAA/cBZR density and apparent binding affinity in the hippocampus and cortex of epileptic and control animals as measured by [18F]-FMZ PET and the partial saturation model.

Results are expressed as Bmax/1/KdVr (mean±SEM, pmol/ml) in control (white bars, n = 7) and epileptic (black bars, n = 8) (**p<0.01; *p<0.05 epileptic vs. control); (A) Bmax values 6 weeks post-SE (B) 1/KdVr values 6 weeks post-SE.
