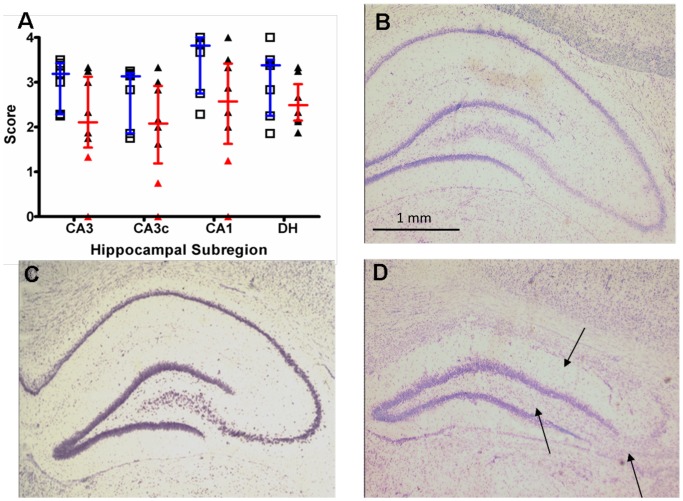
Figure 6. Cell loss as assessed by visual inspection in sub-regions of the left hippocampus 6 weeks post-SE.
(A) Results are expressed as visual score of cell loss (median and inter-quartile range) in control (blue lines, n = 7) and epileptic animals (red lines, n = 8). Individual scores are plotted for control (open squares) and epileptic animals (closed triangles). A subset of epileptic animals showed considerably reduced scoring in CA1, CA3 and CA3c (red triangles, n = 2) indicative of hippocampal sclerosis. Thionin stained sections of the left hippocampus from (B) a control animal (C) an epileptic animal without hippocampal sclerosis/cell loss (D) an epileptic animal with significant hippocampal sclerosis/cell loss as indicated by the black arrows.

