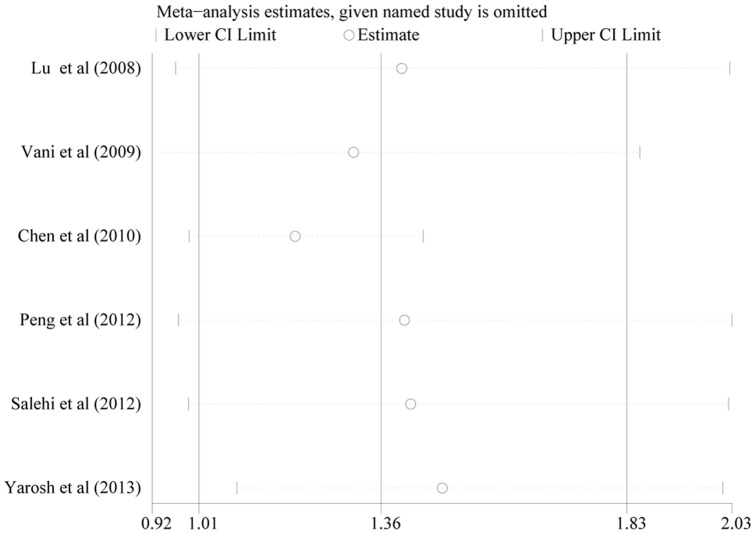
Figure 3. Effect of individual studies on the pooled OR under allele comparison for the 3801T>C polymorphism of CYP1A1 in idiopathic male infertility.
The vertical axis at 1.36 indicates the overall OR, and the two vertical axes at 1.01 and 1.83 indicate the 95% CI. Every hollow round indicates the pooled OR when the left study was omitted in a meta-analysis with a random model. The two ends of every broken line represent the respective 95% CI.

