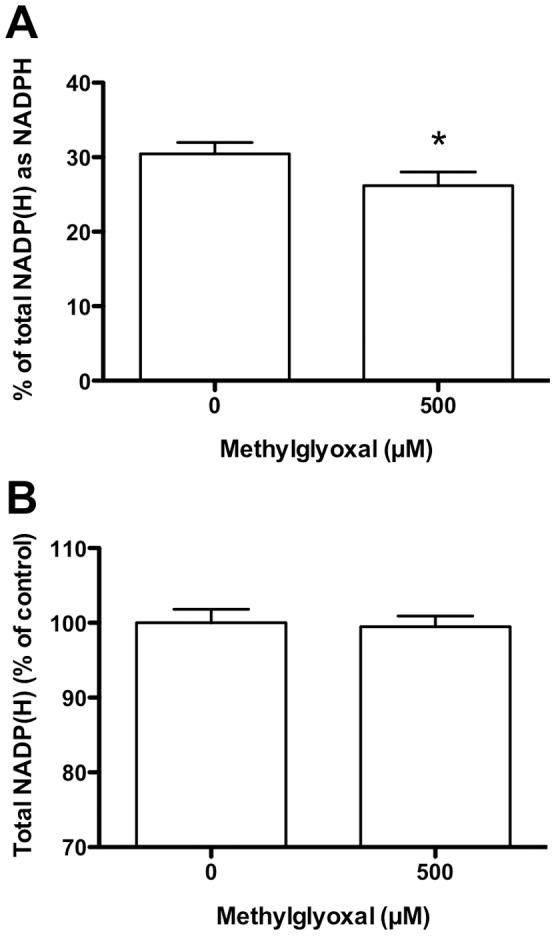
Figure 3. NADPH levels in HCAEC following incubation with MGO.

HCAEC were incubated with 0–500 µM MGO in serum-free medium for 1 h at 37°C, prior to lysis and analysis. (A) Percentage of NADP(H) that is present in the reduced form (NADPH). (B) Total NADP(H) pool (NADP++NADPH). Data are means+SEM of 3 independent experiments each performed in triplicate. *Significant change (P<0.05) compared to 0 µM control (paired t-test of log-transformed data).
